
Over the past decade, Australia’s equity markets have witnessed a significant shift in retail investor activity. From 2015 to 2025, retail traders have become more active in stock trading, aided by low-cost brokerage apps and online forums.
This period saw trading volumes climb, trade sizes shrink, and new channels of market influence emerge.
Regulators like ASIC have closely tracked these trends through detailed quarterly market data releases, which shed light on how retail behaviour is reshaping market dynamics. The following article looks at some of the key metrics and events over the last ten years – including surging pandemic-era participation and the rise of social-media-fueled speculation – to understand the evolving landscape of retail investing in Australia’s share market.
Market Trends and Trading Activity (2015–2025)
Daily Turnover
Over the decade, trading activity in the Australian market increased markedly. In 2015, the equity market averaged about $5.3 billion in daily turnover, which rose to $8–9 billion per day by the mid-2020s. A major factor was the COVID-19 pandemic volatility in early 2020, when daily turnover spiked to record levels – around $9.45 billion on average in Q1 2020, nearly double the typical pre-pandemic level. By the September 2025 quarter, average daily turnover remained elevated at close to $10 billion per day, reinforcing that the market had settled into a structurally higher trading baseline than existed prior to 2020.
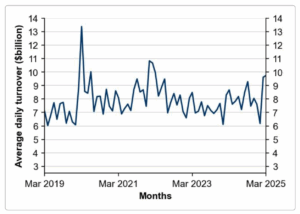
Average daily turnover in Australian equities from 2019 through early 2025 (in $ billions) – note the dramatic spike in March 2020 amid COVID-19 volatility.
Number of trades per day
Alongside rising volumes, the number of trades executed each day grew explosively, reflecting more market participants and more algorithmic order-slicing. In 2015, the market saw roughly 1.08 million trades per day. During the frenzied March 2020 quarter, trade counts skyrocketed – averaging about 2.83 million trades per day. By late 2025, the market was handling around 3 million trades per day, indicating that the elevated level of trading activity seen during the pandemic period had not fully reverted to pre-2020 norms.
Size of trades
In 2015 the mean trade size was around $4.9k, but by 2020 this fell to about $3.3k, and remained low in late-2025 at just over $3.2k per trade, consistent with continued high retail participation and algorithmic order-splitting.
Average trade size on the ASX and Cboe (formerly Chi-X) on-market venues
Trade sizes have trended downward (especially on Cboe), reflecting more frequent small trades by retail investors and algorithmic traders. The market structure itself evolved during this period, with competition between the primary exchange (ASX) and the alternate venue Chi-X (rebranded as Cboe Australia in 2022). In 2015, ASX still controlled the lion’s share of trading – about 82.5% of total equity turnover, versus 17.5% on Chi-X. By the September 2025 quarter, ASX accounted for just over 82% of total on-market value, with Cboe representing just under 18%, suggesting a modest re-consolidation of activity on the primary exchange.
Notably, in extremely volatile periods, traders gravitated even more to the primary exchange – for example, ASX’s share temporarily jumped to 85% during the panic of Q1 2020. Overall, the Herfindahl index of market concentration for lit order books ticked down from roughly 0.71 in 2015 to ~0.66–0.67 in recent years, reflecting a moderate increase in competition between trading venues.
Order-to-trade ratio (the number of orders entered per executed trade).
Viewed over the full decade, changes in the order-to-trade ratio provide a clear structural explanation for many of the behavioural patterns observed among retail investors. In the mid-2010s, the ratio sat closer to 6–7 orders per executed trade, reflecting a market with fewer cancellations and more direct execution. From 2020 onward, the ratio rose sharply, peaking above 9 in 2022–early 2025, indicating a market increasingly characterised by frequent order placement, amendment, and cancellation. This shift aligns with the growth of algorithmic liquidity provision and the influx of retail investors using smaller, more tactical orders. While the ratio eased to around 8 by the September 2025 quarter, it remained materially higher than pre-pandemic levels, suggesting that market behaviour has moderated but not reverted. In this environment, price discovery becomes noisier, short-term trading becomes more competitive, and retail investors face greater execution risk — particularly during periods of heightened online coordination or speculative activity.
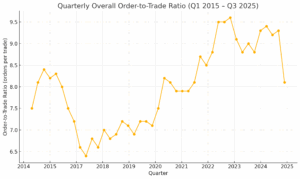
Quarterly Overall Order-to-Trade Ratio in Australian Equity Markets, Q1 2015 – Q3 2025. Each point is the ratio of orders entered per executed trade (higher values indicate more orders per trade). No interpolation or smoothing is applied.
Summary of key changes over the decade
| Metric | Q4 2015 | Q1 2020 | Sep 2025 |
|---|---|---|---|
| Number of trades | ~1.08 million | ~2.83 million | ~3.0 million |
| Turnover (value traded) | $5.3 billion | $9.45 billion | ~$9.7 billion |
| Average trade size | $4,914 | $3,307 | ~$3,220 |
| ASX market share (by value) | 82.5% | 85.1% | ~82.1% |
| Cboe market share | 17.5% | 14.9% | ~17.9% |
| Order-to-trade ratio | 8.2:1 | 7.1:1 | ~8.1:1 |
Table 1: Selected equity market metrics showing how trading intensity and retail-driven characteristics have changed from 2015 to 2025. Trade counts surged and average trade size shrank, especially during the 2020 retail boom, while ASX vs Chi-X market share saw only modest shifts.
The COVID-19 Retail Trading Surge
One of the most pivotal developments in the past decade was the flood of retail investors into the market during the COVID-19 crash of early 2020. As global markets plunged in late February and March 2020, Australian brokerages saw an unprecedented influx of new entrants. ASIC reported an average of 4,675 new trading accounts being opened per day during the turmoil (24 Feb – 3 Apr 2020) – totaling over 140,000 new retail accounts in about six weeks. To put that in perspective, new clients were 3.4 times higher than pre-crisis levels. In addition, many “dormant” retail accounts reactivated: about 21.6% of active accounts in that period were previously inactive for 6+ months. This rush of newcomers and re-engaged investors meant that over 43% of all active retail accounts in March 2020 were either brand new or recently reactivated, a dramatic broadening of the retail base.
Not only were there more retail players, but retail trading activity itself spiked to record levels. In the six months before COVID, retail brokers handled about $1.6 billion in trades per day; during late Feb–March 2020, that jumped to $3.3 billion per day. This surge in retail turnover (up 106%) outpaced even the overall market turnover increase (which was +86% during the crash). However, because institutional and algorithmic trading also rose, the retail share of total market turnover ticked up only slightly – from roughly 10.6% to 11.9% at the peak of the volatility. In other words, retail investors roughly doubled their activity, but remained a minority of overall volume (about one-ninth of all trading by value). This underscores that institutional capital still dominates liquidity, yet retail’s impact became non-trivial at the margins – especially in certain stocks or periods of frenzy.
Crucially, the COVID volatility revealed behavioral patterns of retail traders that raised concerns. Many of these new investors were high-frequency traders – not in the algorithmic sense, but in their tendency to rapidly buy and sell stocks. ASIC noted a “substantial decline in the average time between trades” per investor: prior to the pandemic, the average retail trader waited ~4.5 days before trading the same stock again, but during the crash this shrank to just 1 day. For any stock, the average time between an investor’s trades dropped from 2.5 days to less than 1 day. Retail investors were essentially day-trading en masse, attempting to time quick price bounces in a turbulent market.
Unfortunately, most retail traders were not successful in these short-term bets. ASIC’s analysis showed that on over two-thirds of the days when retail investors were net buyers, the stocks they bought fell in price the next day. And on over half of the days when they were net sellers, the stocks rose the next day (meaning they sold before a bounce). In aggregate, if every retail trade during that period had been held for only one day, the total losses would have exceeded $230 million. This striking figure highlights the perils of “playing the market” in a volatile environment, as ASIC warned: even professionals struggle to time the market, so unsophisticated investors chasing fast profits were particularly dangerous and likely to incur heavy losses.
ASIC took the unusual step of publicly cautioning retail investors in May 2020, stressing that short-term trading during such volatile conditions was akin to gambling. The regulator also flagged risky behavior like increased use of highly leveraged products by retail (e.g. a 159% surge in daily turnover of geared ETFs during the crash) and greater use of “good-til-cancelled” orders that left investors exposed to overnight price swings. This period was a wake-up call: tens of thousands of Australians jumped into stock trading amid a market meltdown, radically altering retail investor demographics, but their rapid-fire trading strategies often backfired in terms of profitability.
Influence of Social Media and Online Forums
The rise of retail investors has coincided with the growing influence of social media, online forums, and “finfluencers” (financial influencers) on market behavior. In the past few years, unregulated online conversations have emerged as a major risk factor for market integrity – capable of whipping up speculative frenzies that can distort stock prices.
A vivid example occurred during the GameStop meme-stock saga in January 2021. While GameStop was a U.S. stock, the frenzy spilled over into Australia in a bizarre way: shares of a tiny Australian mining company, GME Resources (ASX: GME), suddenly soared as much as 53% in a day simply because its ticker code “GME” was the same as GameStop’s. Traders (many organizing on Reddit) piled into the Australian GME stock “for shits and giggles” – unrelated to its fundamentals – entirely due to the mad online phenomenon unfolding around the GameStop ticker. The stock gave up most of those gains by day’s end, but the incident demonstrated how crowd psychology on forums can spill into irrational market moves. As one analyst put it, “It’s got nothing to do with the company and entirely to do with this [Reddit] swarm… playing around with the market for their own amusement.” Such episodes underscore the potential for chaos when viral social media trends hit the markets.
Beyond isolated meme-stock spikes, ASIC has observed more coordinated pump-and-dump schemes emanating from social media channels. In 2020–21, there were multiple pump and dump events targeting micro-cap stocks in Australia, often orchestrated through discussion forums and messaging apps. ASIC’s July 2022 review of these events (Report 732) found that 81% of the trading accounts that participated in organised social-media “pump” campaigns ended up either losing money or at best breaking even. Retail investors who bought into artificially hyped stocks often faced sharp losses when the promoters dumped their shares. The report estimated that retail investors collectively lost about $6.3 million per month by effectively “exiting risk over potentially pumped events” in 2020–21. These schemes have become increasingly sophisticated – regulators noted instances of criminal groups hacking brokerage accounts, exploiting cross-border regulatory gaps, and using private chat groups on WhatsApp and Telegram to coordinate pumps.
By 2025, the issue had gained global regulatory attention. ASIC officials reported that pump-and-dump activity was a “hot topic” in meetings with international regulators, and that these schemes pose a serious threat to market integrity and investor confidence. In Australia, ASIC has ramped up surveillance of social media as part of its market oversight. The regulator’s real-time monitoring now integrates trade data with the surveillance of online forums (X/Twitter, HotCopper, Reddit, Discord, WhatsApp, etc.) to detect suspicious coordinated activity. In late 2025, ASIC explicitly warned that it is “keeping a close eye on small-cap trading activity” and will not hesitate to take enforcement action against market manipulation conducted via social channels. This represents a new frontier of market supervision, recognizing that market-moving information (and misinformation) now often spreads in uncontrolled online venues rather than through official channels.
In tandem, authorities have cracked down on unlicensed finfluencers who were promoting stocks to the public without proper qualifications. ASIC clarified in 2022 that anyone providing investment advice or stock tips as a business (even via YouTube or Instagram) must hold an Australian Financial Services Licence, and began enforcement against violators. A high-profile case was the prosecution of a Twitter/HotCopper personality known as “ASX_Wolf” (real name Gabriel Govinda) – who used 13 different trading accounts to pump small stocks and tout them online, and was sentenced to 2.5 years in prison for market manipulation. Another finfluencer, Tyson Scholz, was banned by the Federal Court for offering paid stock trading courses without a licence. These actions sent a strong signal that using social media to manipulate markets or dispense advice illegally will result in regulatory consequences.
Interestingly, there are signs that such measures have had an effect. A 2023 investor survey by HSBC found that the proportion of Australians seeking investment information on social media dropped from 19% to 13% in the year following ASIC’s finfluencer crackdown. The decline was especially steep among Gen Z investors (from 37% down to 20% relying on social media). Traditional sources like company reports, industry research, and licensed financial advisors have regained prominence over finfluencers. While online stock discussions certainly aren’t going away – and can still fuel sudden bursts of trading – these trends suggest a maturing retail investor base that is perhaps more cautious about who to trust for financial advice. They also reflect the efforts of regulators to rein in the most harmful online market hype without stifling genuine discussion.
Conclusion
The past decade has shown that retail investors are no longer a peripheral force in Australia’s equity markets. Their participation has reshaped trading volumes, execution patterns, and market dynamics in ways that are now structural rather than cyclical. Smaller trade sizes, elevated order-to-trade ratios, and faster turnover reflect a market that is more reactive, more fragmented, and more sensitive to information flows than at any point in the past. While regulators and exchanges have adapted to this reality, the pace and dispersion of modern market signals mean that risk increasingly emerges outside traditional channels.
In this environment, the challenge is no longer simply one of disclosure compliance, but of early awareness and interpretation. Market-moving narratives can now form in real time across online forums, social platforms, and informal investor networks, often well before they surface in price movements or formal announcements. For listed companies, this creates a widening gap between what is being discussed in the market and what is visible through conventional monitoring tools. It also raises the stakes for continuous disclosure, reputation management, and investor communication, particularly during periods of heightened volatility or speculation.
This is where platforms like Quarterback become critical. As markets grow noisier and more complex, companies need the ability to systematically listen to, interpret, and contextualise market conversations as they emerge. By aggregating dispersed market signals and analysing how narratives, sentiment, and trading behaviour evolve over time, Quarterback helps companies move from reactive disclosure to informed preparedness. In a market defined by speed, fragmentation, and behavioural amplification, the ability to understand what the market is saying — and why — is no longer optional. It is an essential component of maintaining trust, managing risk, and operating effectively in Australia’s modern equity landscape.
Sources
- https://www.asic.gov.au/regulatory-resources/markets/market-structure/equity-market-data/2015/equity-market-data-for-quarter-ending-december-2015/
- https://www.asic.gov.au/regulatory-resources/markets/market-structure/equity-market-data/2025/equity-market-data-for-quarter-ending-march-2025/
- https://www.asic.gov.au/regulatory-resources/markets/market-structure/equity-market-data/2020/equity-market-data-for-quarter-ending-march-2020/
- https://download.asic.gov.au/media/5584799/retail-investor-trading-during-covid-19-volatility-published-6-may-2020.pdf
- https://www.investordaily.com.au/new-retail-investors-flood-market-despite-dangerous-conditions/
- https://www.reuters.com/world/asia-pacific/gamestop-mania-drives-jump-aussie-miner-with-similar-stock-code-2021-01-28/
- https://download.asic.gov.au/media/1o1adudd/rep732-published-14-july-2022.pdf
- https://www.asic.gov.au/about-asic/news-centre/find-a-media-release/2025-releases/25-316mr-pump-and-dump-scammers-put-regulators-on-high-alert/
- https://www.moneymanagement.com.au/finfluencer-usage-drops-back-asic-crackdown/
